The physical security industry gained momentum in 2021 as the world began to emerge from (or live with) the pandemic. The digital transformation of the industry has transformed businesses and opened up new applications in security and beyond. However, we see industry optimism tempered by ongoing risks such as geopolitical, economic and supply chain instability. Major industry players are adapting their business strategies to ensure growth through the turbulence and in the year to come.
Read on for a regional analysis of the market and global review and forecast for video surveillance and access control.

FEATURE ARTICLES

My default image Top companies in surveillance & access control
My default image Hanwha Q&A: How AI is boosting security capabilities
My default image Top growth physical security companies

Regional Analysis

Infra, smart city projects propel Asia security EMEA reports growth amid shortages, recession N. America sees cautious optimism post-COVID

Global Market Review & Forecast

2022 Video surveillance market 2022 Access control market

2022 Market Research & Commentary

Memoori annual physical security industry report Novaira Insights: Surveillance market grew, price increased too OSSA: orchestrating the digital data flow

QUICK VIEW

Top 10 Companies in Physical Security

2021 Sales Revenue (in US$ Millions)
1 Hikvision 10,096.98
2 Dahua 5,089.19
3 Assa Abloy 3,320.38
4 Axis 1,362.88
5 Motorola 1,226.00
6 Uniview 941.26
7 Tiandy 825.14
8 Aellegion 602.15
9 Hanwha Techwin 593.45
10 Alphone 473.43

Top 10 Revenue(2021-2020)

15 Chinese companies accounted for 65% of the total Security 50 revenue

Top Growth Companies

Revenue Growth (2021-2020)
1 Evolv Technologies 456.0%
2 CP Plus 46.9%
3 DynaColor 45.1%
4 Webgate 43.1%
5 Intelbras 41.2%
6 YTOT 40.1%
7 Motorola 32.3%
8 Gallagher 29.0%
9 Hanwha Techwin 28.2%
10 TVT 27.3%

Revenue Growth

1 YTOT 92%
2 Aiphone 46%
3 Motorola Solutions 46%
4 Kedacom 42%
5 TVT 41%
6 Dahua 37%
7 Streamax 37%
8 Hikvision 30%
9 Forecam Optics 29%
10 Hanwha Techwin 25%

QUICK VIEW

Top 10 Companies in Physical Security
2021 Sales Revenue (in US$ Millions)

Top 10 Revenue
(2021-2020)

15 Chinese companies accounted for 65% of the total Security 50 revenue

Top Growth Companies
Revenue Growth (2021-2020)

Revenue Growth
(2021 1H - 2020 1H)

FULL RANKING

An unbiased industry ranking of the top 50 physical security companies in the world. Register for free or log in now to access the full list.Go To Rankings

REPORT

Download your copy of our member-exclusive industry analysis of market trends, drivers and predictions for the year ahead.

Download here

ABOUT SECURITY 50

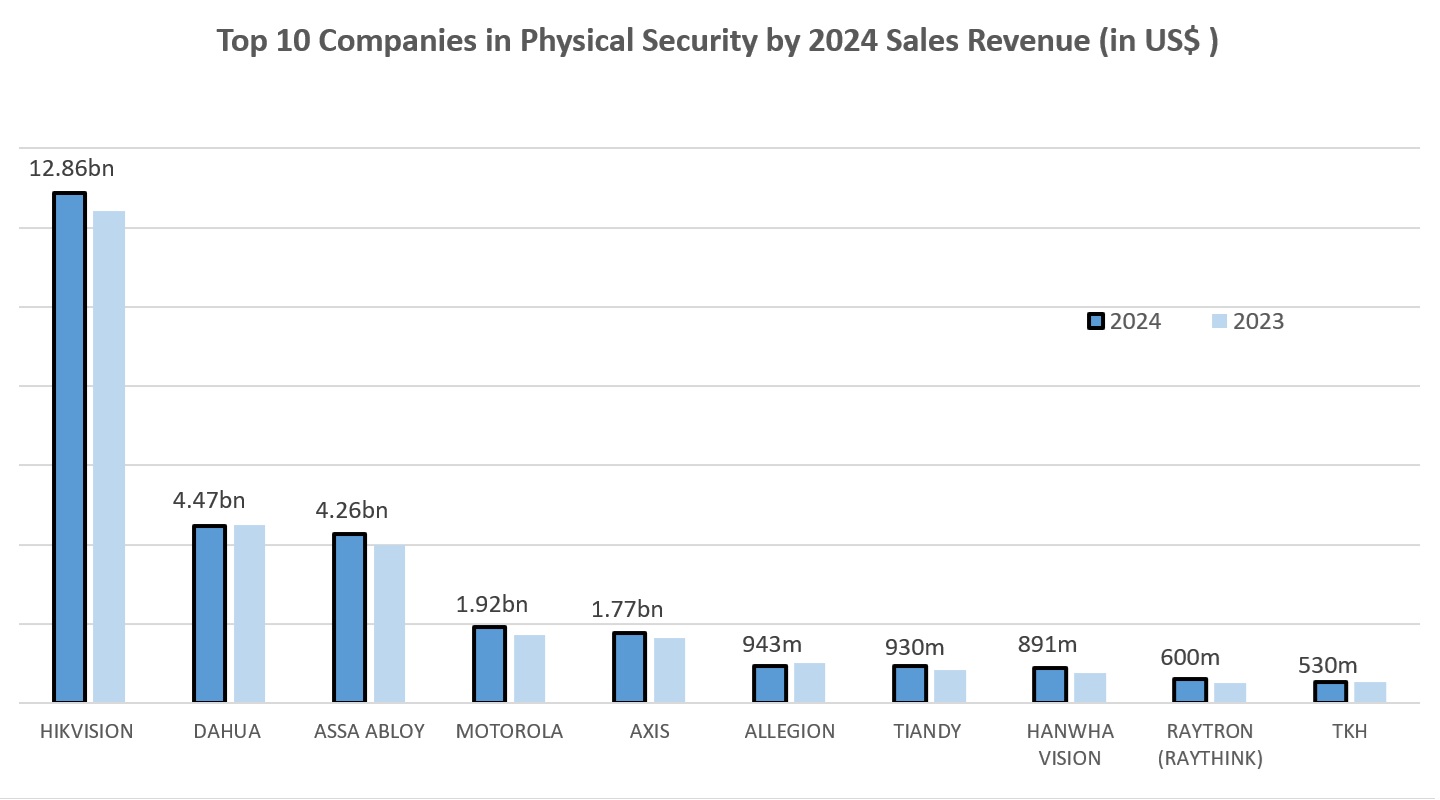
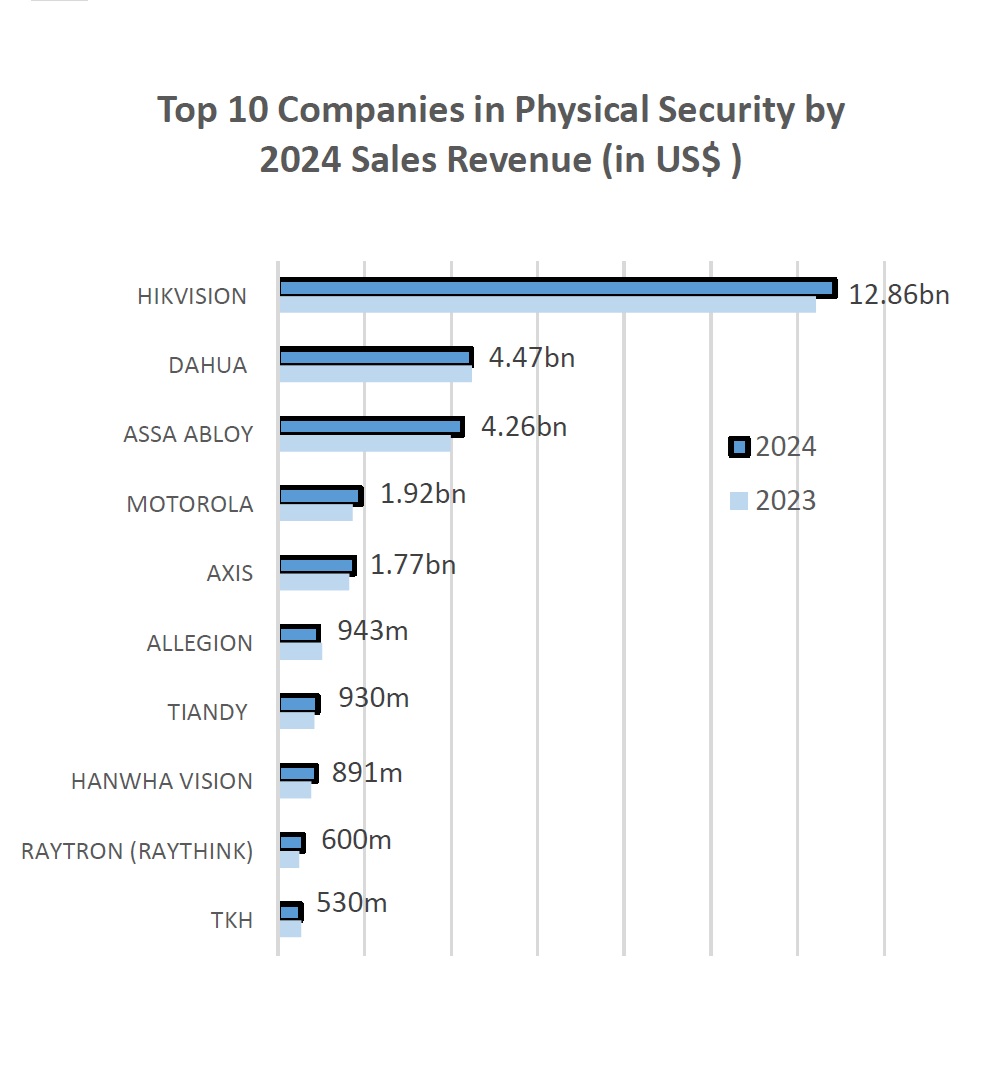
a&s Security 50 is our annual ranking of the 50 largest physical security equipment manufacturers in the world based on product sales revenue and profit. One of the most-read and long-running industry ranking, a&s Security 50 recognizes both global leaders and new market entrants, analyzing data listed in public or submitted financial reports for the 2021 fiscal year.

The ranking aims to reflect the dynamism and developments of the industry as it navigates an ever-changing business and technology landscape. We aim to present a snapshot of the industry and facilitate discussion on industry strategies, corporate management, R&D, business development and other important topics.

a&s Security 50 eligibility criteria:
  • Electronic security equipment and software systems providers, including video surveillance, access control, intrusion detection, key component, and multiple product segments.
  • Security companies or pure manufacturers with their own products, systems, brands or solutions.
  • Distribution, systems integration, reselling, dealing, installation, guard service providers, information security, fire safety companies and other related revenues are excluded.
  • Ability to provide FY2021 and FY2022 financial statements, audited/endorsed by certified accountant or accounting firm.
  • Publicly-listed domestic or multinational companies as well as a small portion of privately-owned companies willing to share their certified annual reports. Their qualification will be carefully verified by the a&s editorial team, in terms of their brand awareness and market share.
Notes to the Financial Figures:
a&s bears no responsibility for the financial information provided by any individual company. For fair comparisons, non-US currencies were converted using midmarket exchange rates from yearly average currency exchange rates announced by Internal Revenue Service (IRS), the US tax collection agency and administers the Internal Revenue Code enacted by Congress. This is an unbiased list based on the willingness of participants to share their sales performance.
Go to Ranking